Welcome to the monthly financial report about the Hive blockchain.
All the information presented in this report is based on the data collected from the blockchain until 2026-04-30 midnight UTC. This report aims to provide you with a clear view of what is happening on the Hive blockchain.
1. Price
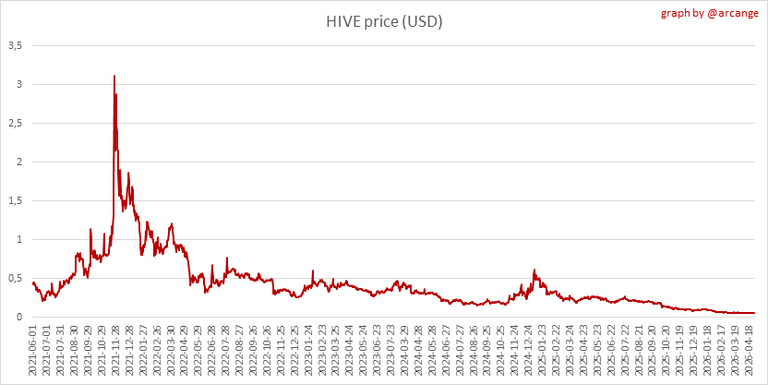 | 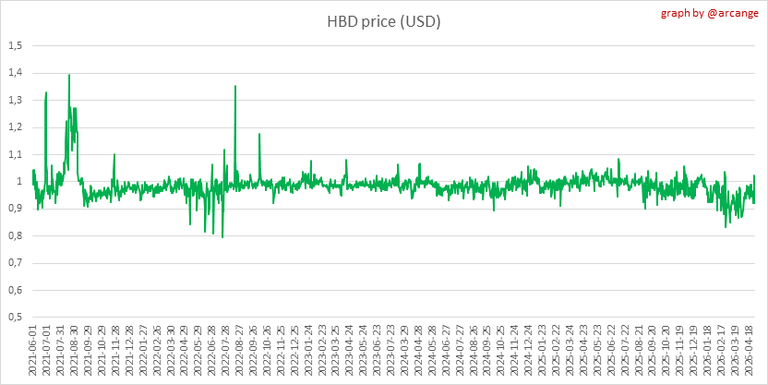 |
These graphs show the evolution of prices in USD for HIVE and HBD.
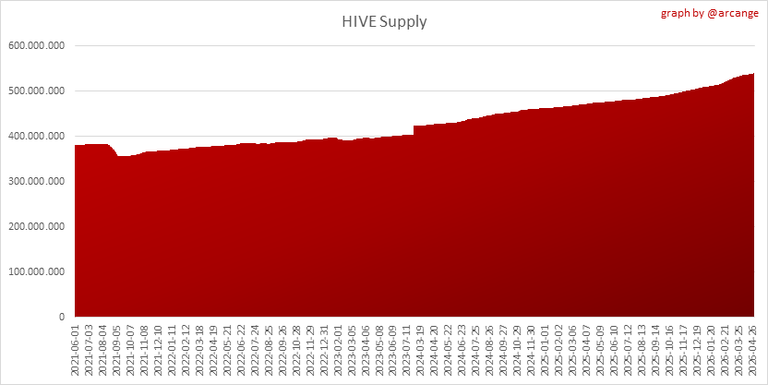
2. Supply
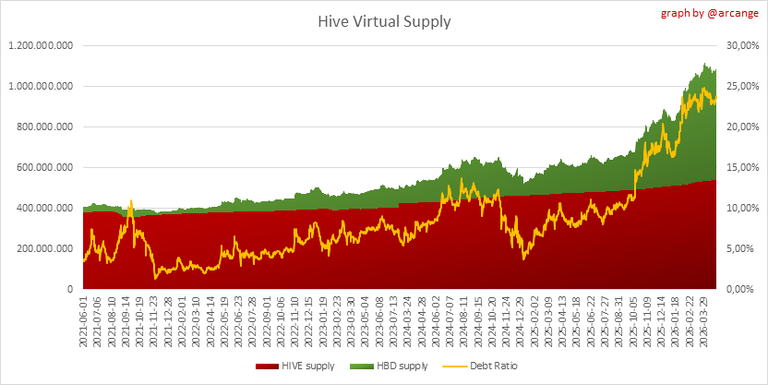
This graph shows the evolution of HIVE virtual Supply. The virtual supply is the sum of HIVE supply (liquid and staked HIVE) and HBD supply (converted into HIVE).
The graph also displays the debt ratio (HBD supply / HIVE virtual supply). Keep in mind that since hardfork 24 funds in the treasury (@hive.fund HBD balance) don't count towards the HBD debt ratio.
 | 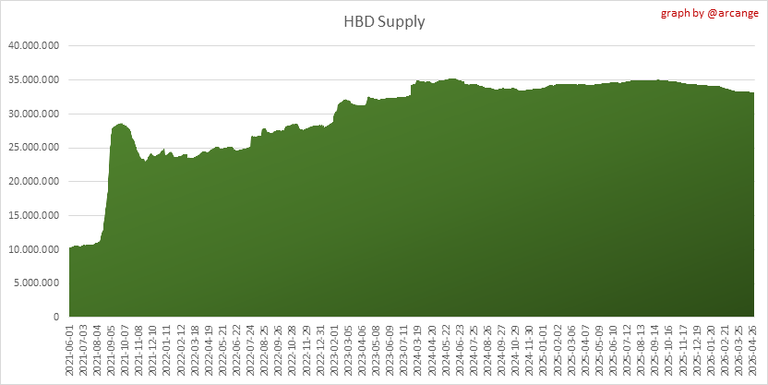 |
These graphs show the evolution of the HIVE Supply (both liquid and staked) and the HBD supply.
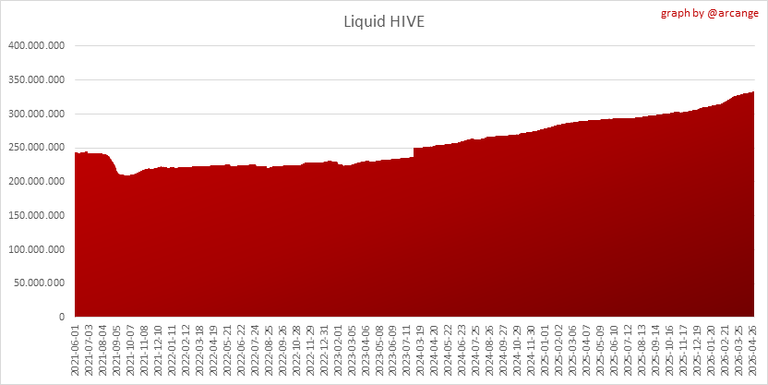 | 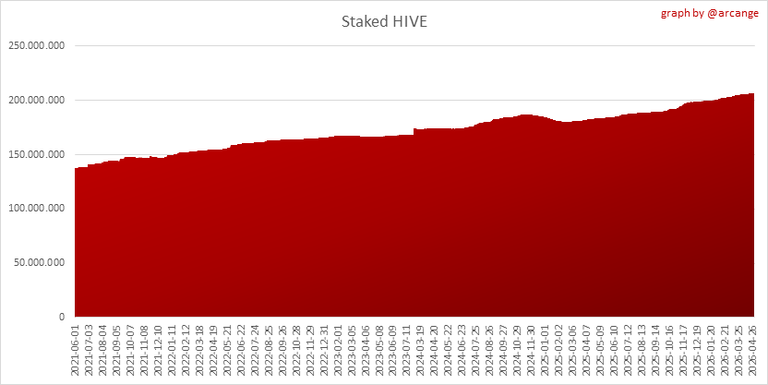 |
These charts show the evolution of the liquid HIVE and the staked HIVE (Hive Power).
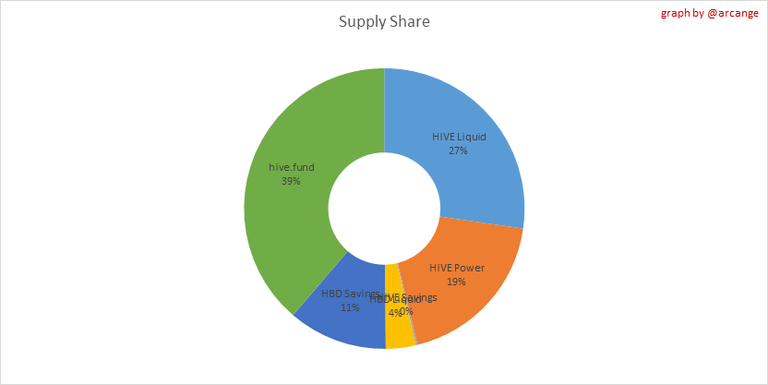
This graph shows the overall Hive tokens distribution.
3. HBD Savings
| Account | Deposit | Account | Withdrawal |
|---|---|---|---|
| @jza | 17,931.911 HBD | @krios003 | 8,036.143 HBD |
| @ok061200 | 262.981 HBD | @risingstarhub | 1,000.000 HBD |
| @valued-customer | 180.283 HBD | @bidnat | 502.250 HBD |
| @azurecherenkov | 127.480 HBD | @takeru255 | 500.000 HBD |
| @edina76 | 50.000 HBD | @vsc.gateway | 327.403 HBD |
| @walterprofe | 5.882 HBD | @gorayii | 55.109 HBD |
| @daveks | 2.263 HBD | @malos10 | 44.899 HBD |
| @fulltimegeek | 2.108 HBD | @eds-d | 40.000 HBD |
| @jacobtothe | 1.646 HBD | @sketch.and.jam | 26.000 HBD |
| @wapitielk | 1.095 HBD | @toqs1986 | 9.269 HBD |
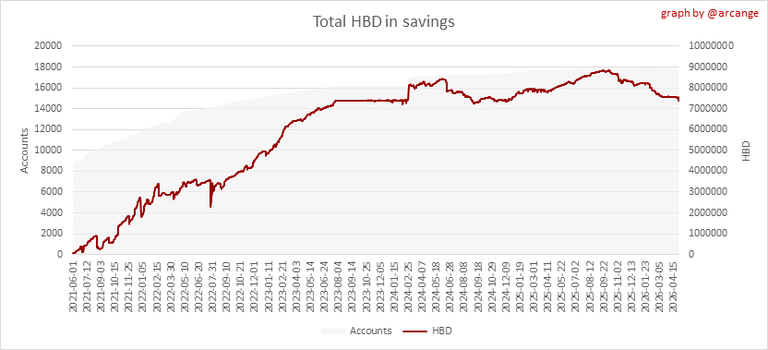
This graph shows how much and how many accounts store HBD in savings. The table below shows the topmost HBD deposits and withdrawals of the day.
Note: As of 2021-06-30 (HF25) interest is only paid for HBD which are stored in savings.
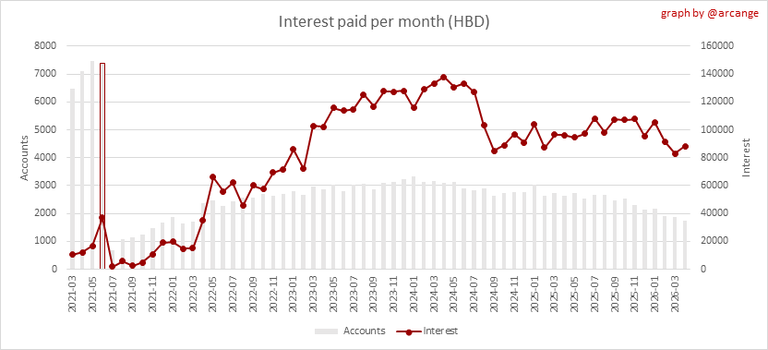
This chart shows the amount of interest paid each month for holding HBD and how many accounts received such interest.
4. Balances
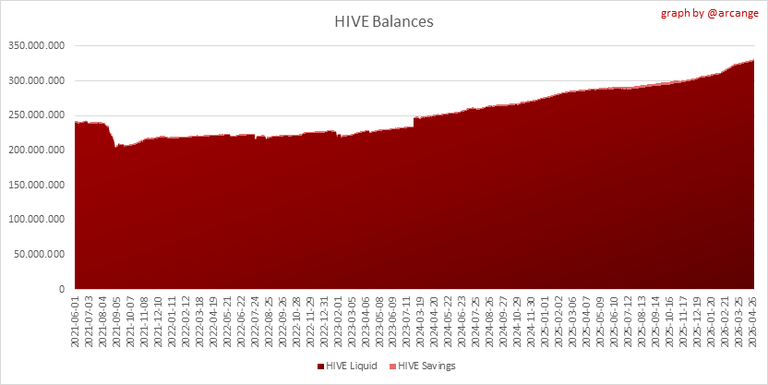
This graph shows the number of HIVE, both liquid and in savings, held by all accounts.
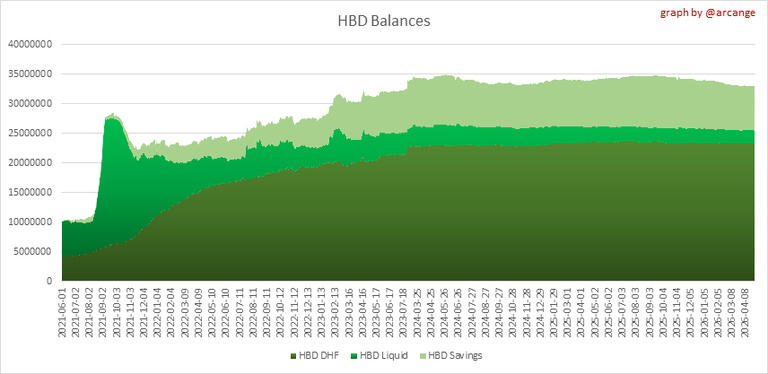
This graph shows the number of HBD, both liquid and in savings, held by all accounts. It also displays the amount of HBD stored in the Decentralized Hive Fund (DHF).
5. Conversions
Note: As a reminder, conversion requests are only finalized after 3 days. It is only then that it is known exactly how many HIVE were burned in return for the HBD received at the time of the conversion request.

This graph shows the number of HIVE collateralized due to requests to convert HIVE to HBD over the past few days.
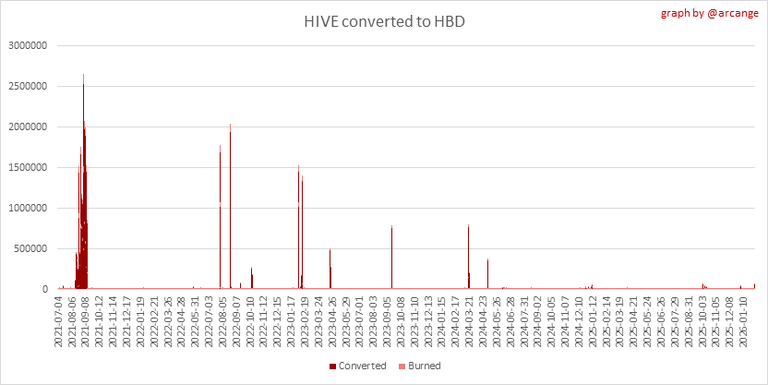 | 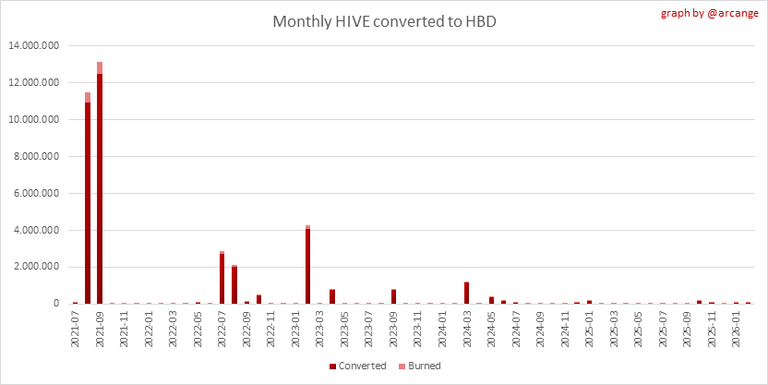 |
These graphs show the number of HIVE effectively used by the conversion process (HIVE converted and 5% HIVE fee which is burned) each day and month when requests to convert HIVE to HBD have been finalized.
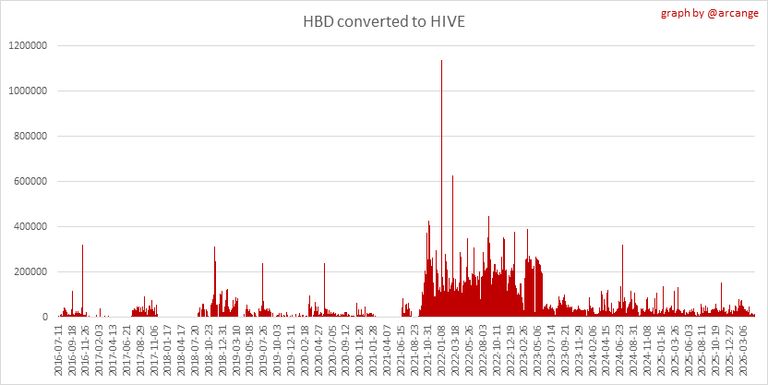 | 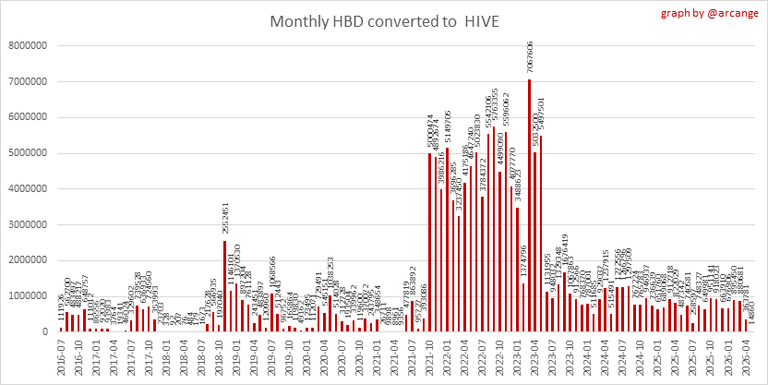 |
These graphs show the number of HBD burned, each day and each month, following requests to convert HBD to HIVE.
6. Powerup and Powerdown
| Date | Account | Amount |
|---|---|---|
| 2026-04-30 02:46:18 | @commentrewarder | 14,129.191 HIVE |
| 2026-04-30 03:55:03 | @cur8 | 3,844.406 HIVE |
| 2026-04-30 09:17:51 | @vincentnijman | 3,806.387 HIVE |
| 2026-04-30 01:55:54 | @amjadsharif | 3,500.439 HIVE |
| 2026-04-30 03:24:33 | @helloisalbani | 2,713.050 HIVE |
| 2026-04-30 11:57:30 | @splinterboost | 2,497.751 HIVE |
| 2026-04-30 10:28:36 | @sunshine29 | 460.045 HIVE |
| 2026-04-30 07:09:36 | @hafsor | 118.428 HIVE |
| 2026-04-30 01:38:18 | @desro | 83.010 HIVE |
| 2026-04-30 09:29:06 | @heyitsjian | 82.008 HIVE |
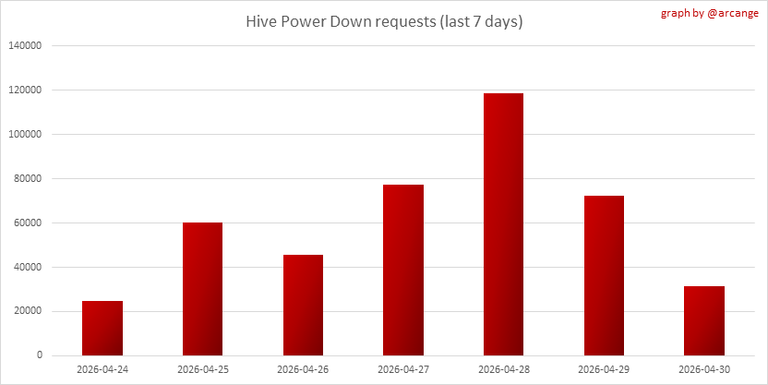
This graph and table show the amount of powerdown initiated over the last 7 days, and the largest initiated on this day.
| Account | Powerup | Account | Powerdown |
|---|---|---|---|
| @captainquack22 | 33,861.312 HIVE | @theycallmedan | 29,278.275 HIVE |
| @davidke20 | 1,020.000 HIVE | @appreciator | 27,842.776 HIVE |
| @darth-azrael | 845.295 HIVE | @schlees | 8,593.897 HIVE |
| @devmamun | 753.957 HIVE | @nomnomnomnom | 7,876.593 HIVE |
| @jeremiahcustis | 456.348 HIVE | @guiltyparties | 2,315.223 HIVE |
| @diyhub | 287.590 HIVE | @muterra | 1,848.883 HIVE |
| @sagarkothari88 | 222.660 HIVE | @adamferrari | 1,842.508 HIVE |
| @erilej | 128.580 HIVE | @musicvoter2 | 1,048.783 HIVE |
| @alessandrawhite | 120.000 HIVE | @commentrewarder | 1,037.527 HIVE |
| @lolitaanana001 | 100.040 HIVE | @atyh | 1,004.893 HIVE |
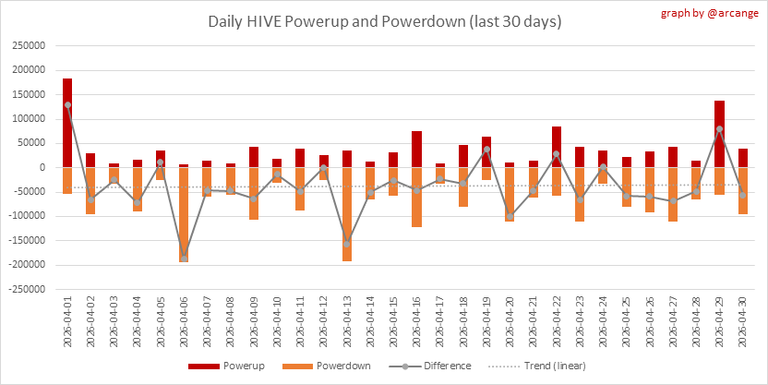
This graph shows the daily HIVE power-up, power-down, and the resulting variation over the last 30 days. The table shows the topmost power-ups and power-downs of the day.
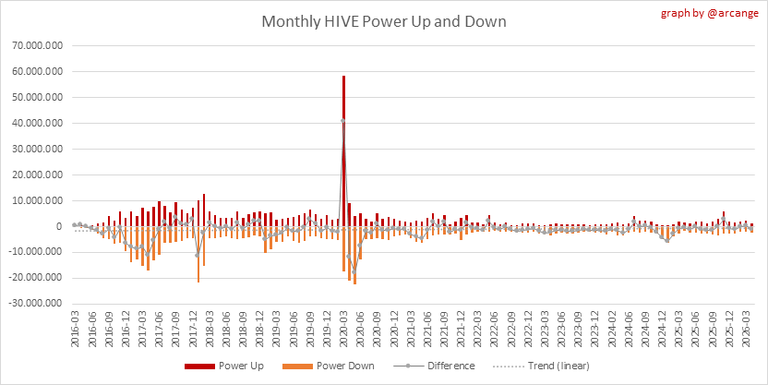
This graph shows the monthly HIVE power-up, power-down and the resulting variation.
Values for the last 3 months
| Period | Powerup | Powerdown | Difference |
|---|---|---|---|
| 2026-04 | 1,186,293.000 | 2,301,189.000 | -1,114,896.000 |
| 2026-03 | 2,336,888.000 | 2,051,926.000 | 284,962.000 |
| 2026-02 | 1,912,342.000 | 1,928,590.000 | -16,248.000 |
7. Transfers
These graphs show the volume (in USD) of HIVE and HBD transferred between accounts.
8. Exchanges
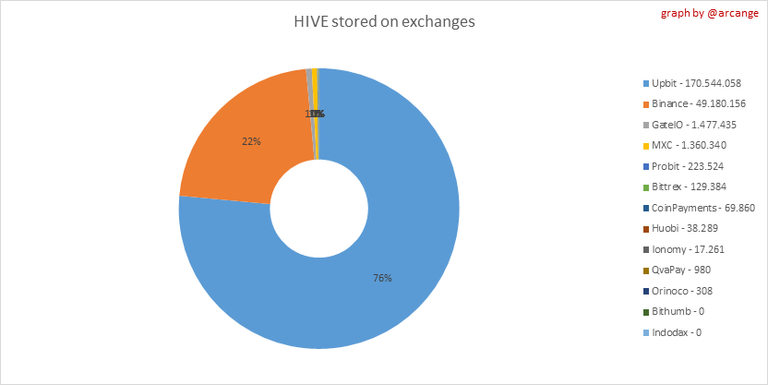 | 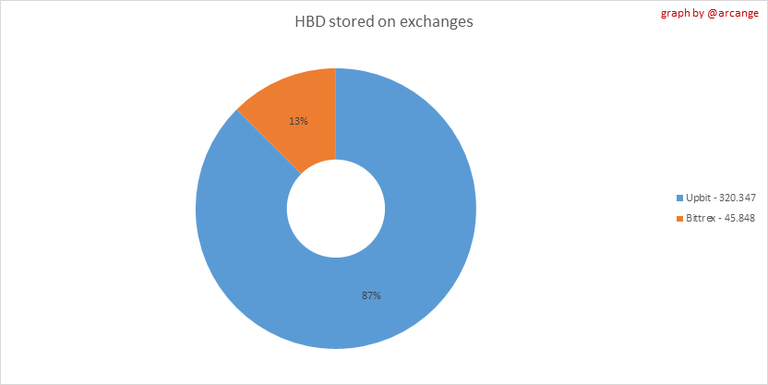 |
These graphs show the amount and distribution of HIVE and HBD stored on the exchanges where they are listed.
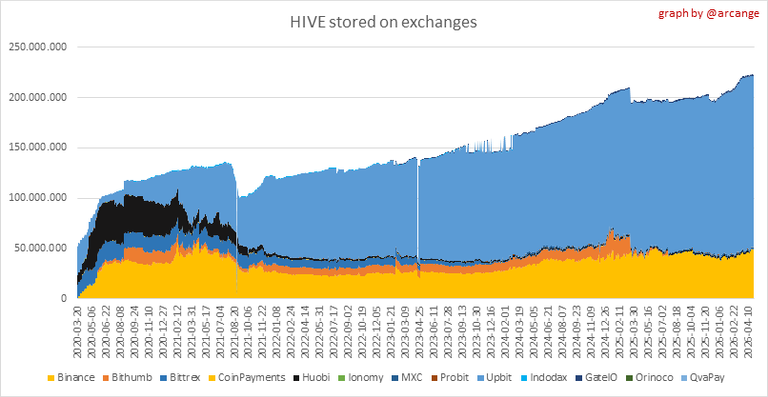 | 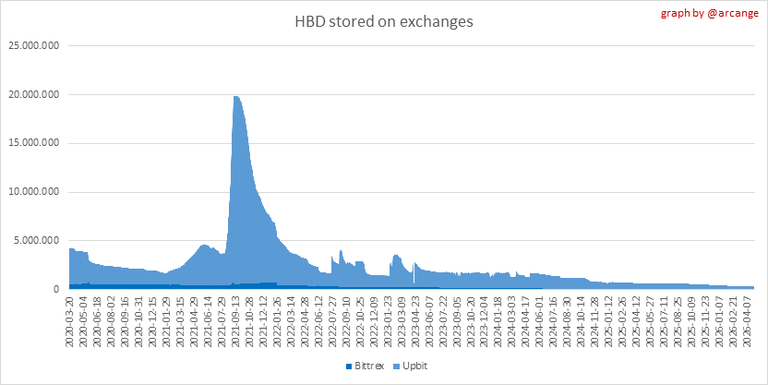 |
These graphs show the daily evolution of HIVE and HBD stored on the exchanges where they are listed.
I hope you find those stats useful. If you would like to see additional stats, feel free to drop me a comment. Your feedback is more than welcome.
Thanks for reading.
Check out my apps and services