In this post, I’m comparing the results of two strategies I’m running side-by-side: holding HIVE as Hive Power and saving HBD, versus actively day trading HIVE and HBD.
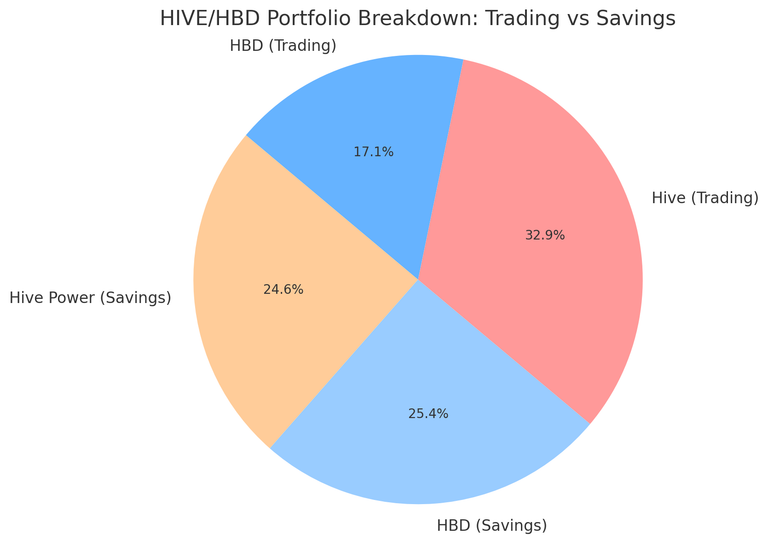
📊 Portfolio Breakdown (as of August 7, 2025) Here’s what my portfolio looks like today:
TypeAmount USD Value
Hive Power 580.923 $124.34
HBD Savings 128.194 $127.94
Hive (Trading) 775.095 $165.87
HBD (Trading) 86.569 $86.40
Total in Savings: $252.28
Total in Trading: $252.27
🧠 Analysis After factoring in prices — HIVE at $0.214 and HBD at $0.998 — the portfolios are nearly identical in USD value.
This suggests the market has been stable enough that holding or trading are yielding similar values — at least for now.
🖼 Visual Breakdown Here’s the current portfolio split between my Hive Power/HBD Savings and Hive/HBD Trading accounts:
(see chart above)
💭 Final Thoughts So far, this experiment is just getting started. The goal is to track both over time and see which approach performs better in the long run — stable savings interest or volatility-driven trading gains. I’ll be updating daily, logging trades, and analyzing results week-by-week.
Stay tuned for tomorrow’s update and feel free to share your own strategies below!


